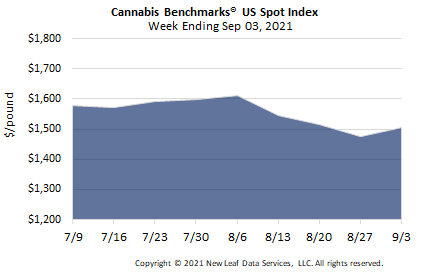
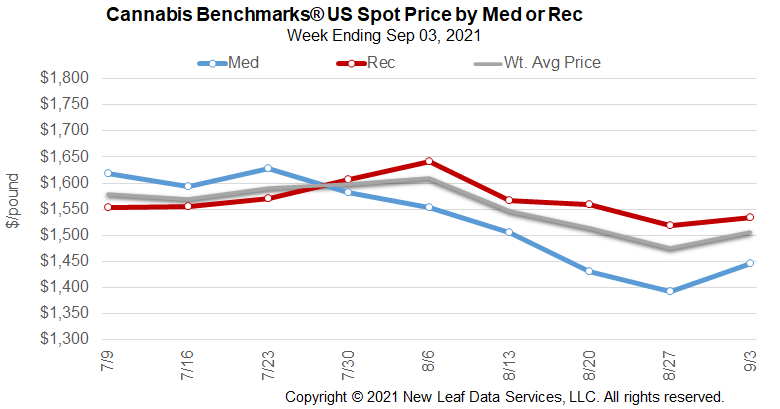
U.S. Cannabis Spot Index increased 2.1% to $1,507 per pound.
The simple average (non-volume weighted) price decreased $6 to $1,787 per pound, with 68% of transactions (one standard deviation) in the $959 to $2,615 per pound range. The average reported deal size was 2.4 pounds. In grams, the Spot price was $3.32 and the simple average price was $3.94.
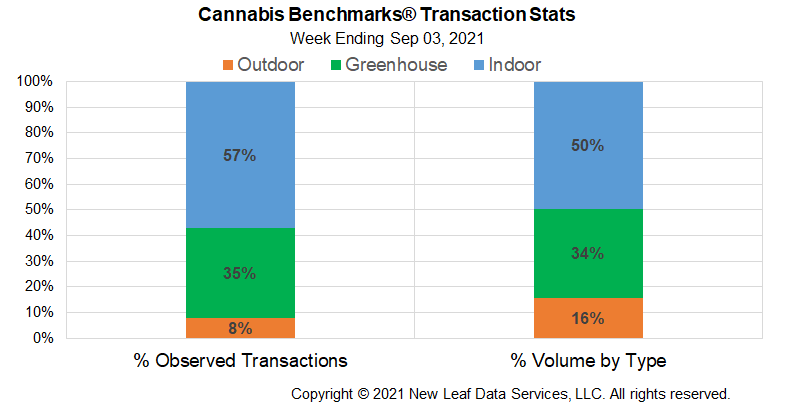
The relative frequency of transactions for indoor flower decreased by 1% this week. The relative frequency of trades for greenhouse product was unchanged and the frequency of outdoor transactions increased by 1%.
The relative volume of outdoor product fell by 1% this week. The relative volume of greenhouse flower was unchanged versus last week, while indoor flower’s relative volume increased by 1%.
The U.S. Spot Price has been in a downward spiral recently, losing just over $192 in August. Price has come under pressure in legacy legal states with large licensed markets – namely, California, Oregon, and Colorado – all experiencing significant price pressure leading into harvest season. In brief, light-deprivation and outdoor crops are coming to markets over-supplied with last year’s inventory. Over the past several weeks northern California and Oregon growers have noted a large inventory overhang, with price pressure most marked on outdoor-grown flower. Reports from market participants told of outdoor product fetching as low as $200 per pound, while trim was seen trading down at $50 per pound.
As noted in last week’s report, legacy, high production states are weighted more heavily in the U.S. Spot Index by virtue of the larger trading volumes in those markets, thus pushing spot prices sharply lower over the past several weeks as losses accumulate in these states. As of last week, California’s Spot Index was down just over $220 since the third week in July. Oregon’s Spot also fell off over $196 per pound since late July 2021. Colorado prices fell somewhat less, losing $127 from mid-June 2021 to late August 2021. Yet, from a longer term perspective, the U.S. Spot has fallen just $71 from late August 2020 to late August 2021, reflecting the fact that price pressures in legacy states started accumulating in the late spring and early summer of this year.
The chart below depicts the U.S. spot sell-off accelerating as the year-to-date trendline was tested and did not hold. There is a chance the U.S. Spot will recover in the coming weeks with demand for newly harvested flower ramping up and there is some technical support near current levels dating back to January 2021 and in July 2020.
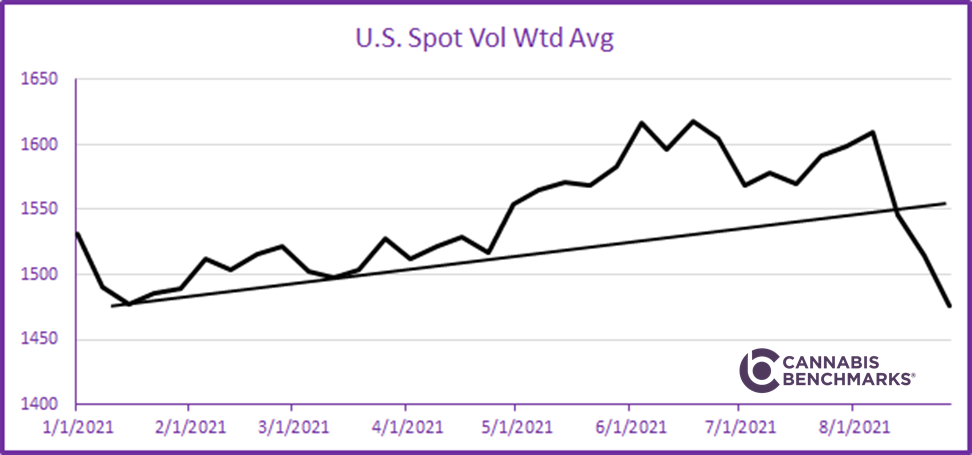
The chart illustrates a trading truism: the downside is fast and the upside is slow, meaning falling markets are more volatile than rising markets. It took from January 2021 to June 2021 for the U.S. Spot to gain $142 per pound, but it has taken just over three weeks for it to lose $134 per pound, illustrating the need to hedge downside exposure. As historical data demonstrates, cannabis prices have an element of seasonality that market participants will be able to hedge against, thus locking in price at their chosen level.

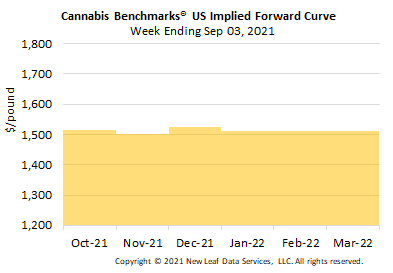
March 2022 Implied Forward initially assessed at $1,510 per pound.
The average reported forward deal size was 70 pounds. The proportions of forward deals for outdoor, greenhouse, and indoor-grown flower were 44%, 39%, and 17% of forward arrangements, respectively.
The average forward deal sizes for monthly delivery for outdoor, greenhouse, and indoor-grown flower were 93 pounds, 61 pounds, and 30 pounds, respectively.
The chart below shows the Cannabis Benchmarks® U.S. Spot Index over the past year appended with the Implied Forward Curve.

National
U.S. Spot Prices Catch Up with Legacy State Pricing
Nevada
June Sales Slip Month-on-Month
Oregon
Office of Economic Analysis Publishes Outlook for Cannabis Sales
Washington
State Implementing New Cannabis Traceability System