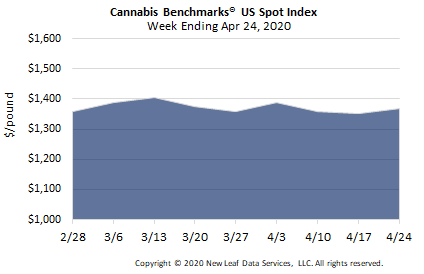
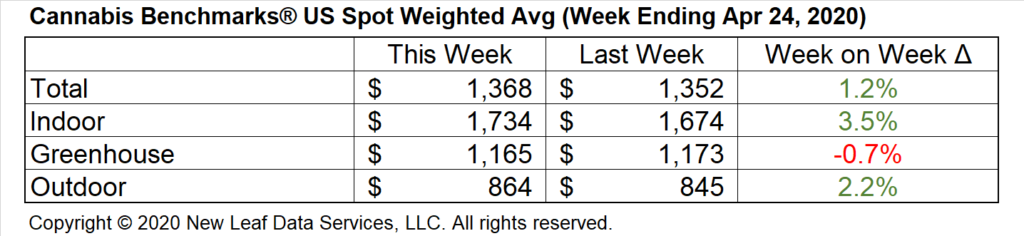
U.S. Cannabis Spot Index up 1.2% to $1,368 per pound.
The simple average (non-volume weighted) price increased $48 to $1,588 per pound, with 68% of transactions (one standard deviation) in the $861 to $2,315 per pound range. The average reported deal size increased to 2.3 pounds. In grams, the Spot price was $3.02 and the simple average price was $3.50.
The relative frequency of trades for outdoor flower increased by almost 2% this week. The relative frequencies of deals for indoor and greenhouse product decreased by about 1% each.
Outdoor flower’s share of the total reported weight moved expanded by over 2% this week. The relative volumes of warehouse and greenhouse product each contracted by about 1%.
![]()
In recent weeks, large month-over-month increases in March sales figures in Oregon and Arizona have been framed by some reports as a direct result of the COVID-19 pandemic and accompanying panic-buying. Cannabis consumers and patients in several markets have indeed been stocking up ahead of stay-at-home orders going into effect, or based on general apprehensions of the possibility of the closure of cannabis retail, as demonstrated by the long lines at licensed shops documented in numerous states prior to restrictions on movement being put in place.
However, a more detailed and contextualized look at official sales figures suggests that established seasonal sales patterns and previously-existing growth trends may be primarily responsible for impressive March sales figures, with coronavirus-related purchasing contributing to boost sales higher than they might have been otherwise. In what follows, we focus on Oregon and Arizona, two of the markets for which official March sales data is available, along with several years of historical data.
First, seasonal sales patterns must be acknowledged. In recent years, March has established itself in many legal cannabis markets as the strongest sales month of the first quarter, and sometimes of the first half, of any given year. Additionally, March sales in numerous markets in past years have frequently represented new record retail revenue figures, which are typically then surpassed in the summer months.
In Oregon, March sales represented record highs for the state’s market at the time in each year from 2017 through 2019, making 2020 the continuation of a trend that has been documented from the outset of the state’s licensed system. In Arizona, total sales volume of all products and flower sales volume specifically also set new records for the state’s market in March in each year from 2017 through 2019, just as another new record was established this year.
Second, while month-over-month sales increases reported for March 2020 out of Oregon and Arizona are impressive, they are not substantially out of line with those documented in prior years. In Oregon, March 2020’s retail revenues rose by about 24% from February. In 2017, sales rose by about 21% from February to March; 2018 saw around an 18% increase in the same period; while 2019 saw a roughly 19% climb. Overall for 2019, annual sales in Oregon were up by about 22% from the year before. March 2020’s month-over-month increase did outpace those of prior years, but growth rates for the February-March period in Oregon have typically been about 20% since the state’s licensed market opened.
March sales in Arizona’s medical cannabis market have also consistently seen robust growth in the years leading up to and including this one. Total sales volume of all products rose by 14.8% month-over-month in March 2020. In March 2017, the rate of increase in this metric was 15.5%; it was 16.3% in 2018, and 11.7% in 2019. Flower sales volume rose by 15.1% in March 2020, a larger magnitude than the 10.9% increase recorded in March 2019, but in line with the 15.9% and 15.5% increases in this metric documented in March 2018 and 2017, respectively.
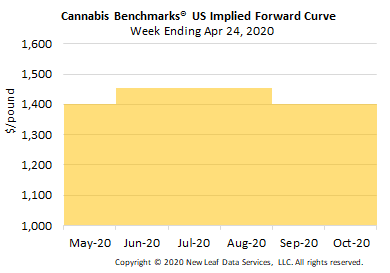
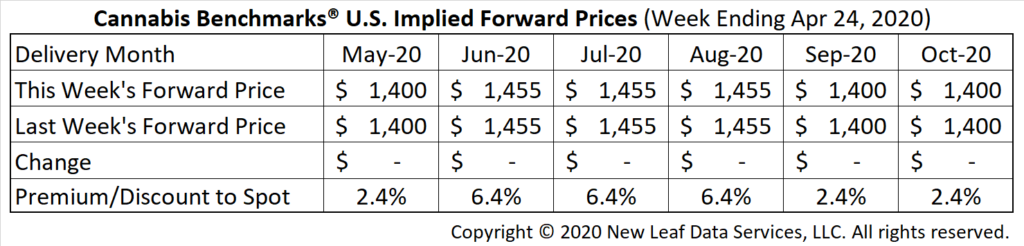
May Forward closes unchanged at $1,400 per pound.
The average reported forward deal size was nearly 37 pounds. The proportion of forward deals for outdoor, greenhouse, and indoor-grown flower was 46%, 37%, and 17% of forward arrangements, respectively. The average forward deal sizes for monthly delivery for outdoor, greenhouse, and indoor-grown flower were 43 pounds, 29 pounds, and 36 pounds, respectively.
At $1,400 per pound, the May Forward represents a premium of 2.4% relative to the current U.S. Spot Price of $1,368 per pound. The premium or discount for each Forward price, relative to the U.S. Spot Index, is illustrated in the table below.
Headlines From This Week’s Premium Report:
National
Are Robust March Sales the Result of COVID-Related Bulk Buying or Existing Seasonal Trends and Market Growth?
Oregon
Rule to Allow Random Testing of Products for Adulterants and Contaminants Now in Effect
Michigan
Adult-Use and Medical Sales Rise Sharply in March as Supply Appears to Begin to Loosen
Arizona
Total Sales Volume Tops 17,000 Pounds in March, Establishing New Record for State’s Medical Market
