

Canada Cannabis Spot Index (CCSI)
Published November 29, 2019

*The provincial excise taxes vary. Cannabis Benchmarks estimates the population weighted average excise tax for Canada.
**CCSI is inclusive of the estimated Federal & Provincial cannabis excise taxes..
The CCSI was assessed at C$6.37 per gram this week, down 0.8% from last week’s C$6.43 per gram. This week’s price equates to US$2,177 per pound at the current exchange rate.
This week we analyse Cannabis Benchmarks’ estimate of the total grams of cannabis sold in each province, along with how much an average consumer purchases each month. Since the inception of legal recreational cannabis markets, we have seen a steady increase in the total grams sold across each province. As we have established in past reports, this comes with a growing retail presence in provinces such as British Columbia and Ontario, as well as declining prices nationwide.
The chart below is our estimate of the number of grams sold each month for different provinces and regions of the country. This view gives a side-by-side comparison of the growth and trends in the Canadian cannabis market.
Source: Cannabis Benchmarks
We then divided the totals in the chart above by the number of cannabis users, as reported by Statistics Canada, to reach an estimate of average per-person monthly purchase volume.
Source: Cannabis Benchmarks
Although the overall picture in both charts look similar in many respects, there are some differences and notable takeaways.
- Alberta has seen steady sales growth in conjunction with the exponential expansion in the number of retail stores. On average, each reported cannabis consumer purchased 3.5 grams of dry cannabis each month from the licensed market in August, the most recent month for which data is available.
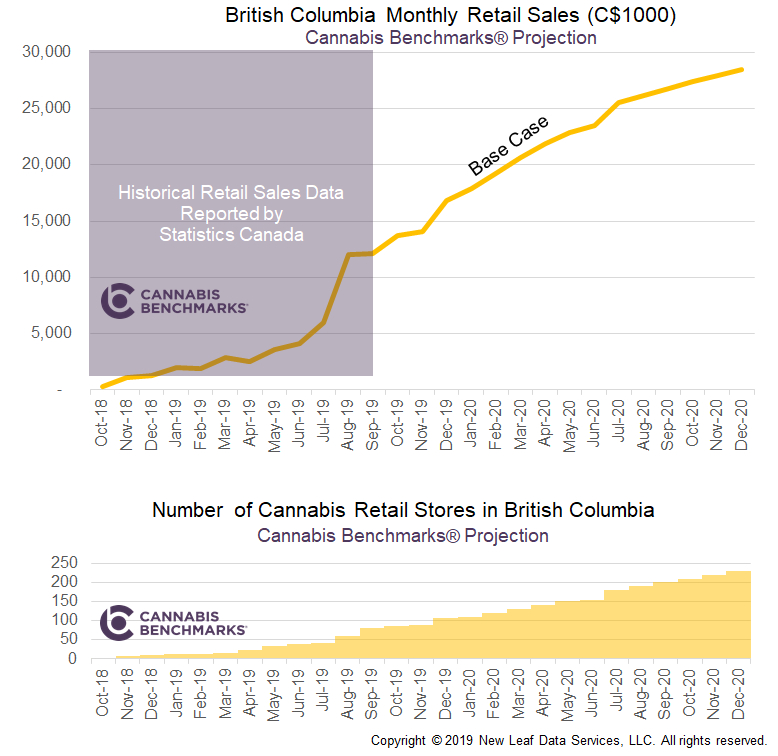
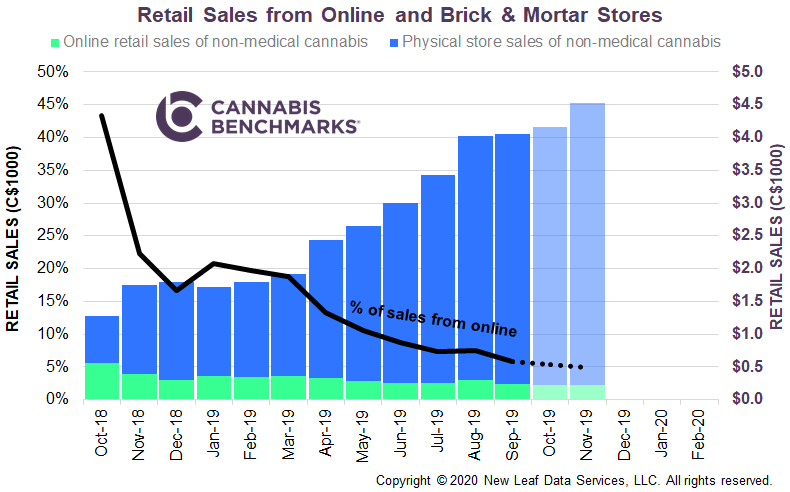
- British Columbia’s legal cannabis market has seen relatively low purchasing levels. However, the data shows a big jump in sales in August, with the rapid increase in the number of physical stores and falling prices leading to licensed sellers becoming more competitive with the illicit market.
- The Prairie provinces show some of the highest purchase volumes per cannabis user, but that appears to have plateaued at around 3.5 grams per month beginning this spring.
- Ontario significantly lags below the national average in sales volume per cannabis consumer. Changes to rules around retail licenses, storage, and distribution processes will likely lead to accelerated consumption in Ontario in the future.
- Total sales volume in Quebec, and its growth trajectory, is comparable to that reported for Alberta, despite the former having double the population of the latter.
- The Maritime provinces have shown some of the strongest and most consistent per-consumer purchase volumes. The average cannabis user in these four eastern provinces has consistently bought between 2.5 and 3.5 grams per month from the legal market since October 2018.
For more data and analytics like this, please sign up to become a BETA client of our market fundamentals dashboard. Please click the link below to register and we will email you directly as our platform becomes available.