

Canada Cannabis Spot Index (CCSI)
Published March 6, 2020

*The provincial excise taxes vary. Cannabis Benchmarks estimates the population weighted average excise tax for Canada.
**CCSI is inclusive of the estimated Federal & Provincial cannabis excise taxes..
The CCSI was assessed at C$6.40 per gram this week, up 0.6% from last week’s C$6.36 per gram. This week’s price equates to US$2,169 per pound at the current exchange rate.
Include your weekly wholesale transactions in our price assessment by joining our Price Contributor NetworkIf you have not already done so, we invite you to join our Price Contributor Network, where market participants anonymously submit wholesale transactions to be included in our weekly price assessments. It takes two minutes to join and two minutes to submit each week, and comes with loads of extra data and market intelligence.
This week, we analyze household consumption expenditure data from the Canadian government. Household consumption expenditure data monitors on a quarterly basis the final spend made by Canadian residents to meet their everyday needs, such as food, clothing, housing, energy, transport, health costs, leisure, and miscellaneous services. It is typically around 60% of gross domestic product (GDP) and is therefore an essential variable for economic analysis of demand. Starting last year, the Canadian government started issuing the quarterly spend on cannabis alongside alcoholic beverages and tobacco. In the chart below, we have aggregated the cannabis spend for medical, legal recreational, and illicit products. Interestingly, all three product categories illustrated below observed steady to slightly rising sales over the past 12 quarters, or three years. Our thought was that the legalization of cannabis would have cut into the alcoholic beverages sales, but so far that has not been the case. From 2018 to 2019, the total spend on alcoholic beverages increased by 2.6%, while the cannabis spend increased by 3.6%.
Source: Cannabis Benchmarks, Statistics Canada
In terms of 2019 recreational use (not including cannabis sold for medical use), cannabis made up only 11% of the total dollars spent. Spending habits are likely to change in 2020 with the introduction of Cannabis 2.0 products, such as vapes, beverages, and edibles.
Source: Cannabis Benchmarks, Statistics Canada
Focusing only on cannabis expenditures in Canada, we can see how spending has shifted in this category. The data shows that the total cannabis spend has been between roughly C$1.4 – C$1.5 billion each quarter since 2017.
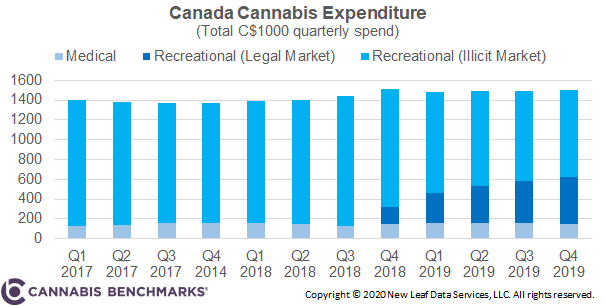
Source: Cannabis Benchmarks, Statistics Canada
From this data we notice a few key points.
-
The medical spend has stayed quite consistent at around C$150M per quarter, despite Statistics Canada reporting a decline in medical cannabis sales volumes as consumers turn to the legal recreational market for their supply.
-
The total legal recreational cannabis spend increased on average by 7% from the pre-legalization period to the legal cannabis markets that started in Q4 2018. This increase is a result of legal cannabis being more expensive, as well as a growing base of legal cannabis consumers with more access to legal outlets.
-
In 2019, the illicit market accounted for 71% of all cannabis sales.
-
Lastly, since cannabis legalization, the legal markets have consistently been taking market share from the illicit markets, although at a decreasing rate. Below is a chart that shows the quarter-on-quarter (QoQ) change in recreational cannabis expenditure. The mirror image verifies that as the illicit cannabis spend drops each quarter, it is converted to the legal markets.
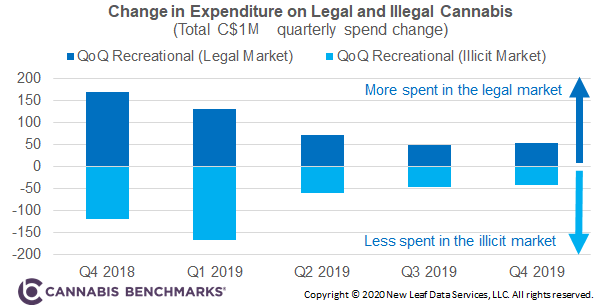
Source: Cannabis Benchmarks, Statistics Canada
For more data and analytics like this, please sign up to become a BETA client of our market fundamentals dashboard. Please click the link below to register and we will email you directly as our platform becomes available.
If you missed our announcement last week:
We are pleased to share that Cannabis Benchmarks® has begun disseminating its Canada cannabis index data through Nasdaq’s GIDS service. These unbiased indexes provide a variety of benefits for this emerging commodity, including:
– making it easier to reference the market value of product in buy/sell negotiations,
– writing spot and forward contracts on a published index,
– third-party validation for asset valuation (e.g., biological assets), and
– paving the way for more sophisticated financial instruments for hedging, trading, and risk management (e.g., swaps, futures, and other derivative contracts).
Click to read the full press release: Cannabis Benchmarks® Distributes its Canada Cannabis Pricing Indexes on Nasdaq Global Index Data Service