

Canada Cannabis Spot Index (CCSI)
Published February 28, 2020

*The provincial excise taxes vary. Cannabis Benchmarks estimates the population weighted average excise tax for Canada.
**CCSI is inclusive of the estimated Federal & Provincial cannabis excise taxes..
The CCSI was assessed at C$6.36 per gram this week, up 1.3% from last week’s C$6.28 per gram. This week’s price equates to US$2,168 per pound at the current exchange rate.
Include your weekly wholesale transactions in our price assessment by joining our Price Contributor NetworkIf you have not already done so, we invite you to join our Price Contributor Network, where market participants anonymously submit wholesale transactions to be included in our weekly price assessments. It takes two minutes to join and two minutes to submit each week, and comes with loads of extra data and market intelligence.
This week, we analyze newly released retail sales data from Statistics Canada. With the December 2019 data release, we now have a complete look at sales for the 2019 calendar year. Total Canadian recreational cannabis sales for 2019 are reported to be C$1.19 billion. December sales were C$146M, a jump of C$11M, or 8%, from the previous month. The increase in revenue is largely due to more physical stores opening. As reported last week, we counted 770 more retail stores across Canada as of February 2020, with the number expanding from less than 600 in November 2019 to over 650 in December 2019.
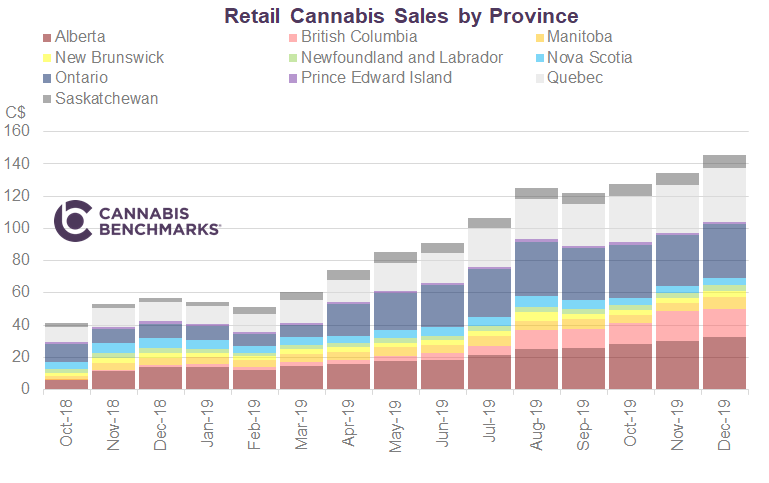
Source: Cannabis Benchmarks, Statistics Canada
The 2019 calendar year was largely restricted to Cannabis 1.0 products. Cannabis 2.0 products were available in the last few weeks of 2019, although selection and supply were quite limited. In our January 10 report, we clarified the new product types available in the Cannabis 2.0 era.
-
Cannabis 1.0 refers to the first phase of THC product legalization in Canada, which included the sale of dry flower (combustible products) and cannabis oils, as well as cannabis plants and seeds.
-
Cannabis 2.0 refers to the legalization of edibles, extracts, and topicals.
In the Cannabis 1.0 era of legalization, the relationship between store counts and sales was observed to be predictable through a logarithmic relationship; in other words, there was a rapid rise, followed by a leveling off of daily sales as more physical outlets opened and total dollars spent were distributed over a greater number of locations. The average daily sales per store in Canada over Q4 2019 was C$7,300. This is a drop from Q3 2019, when average daily in-store sales were C$8,660.
In the chart below, the number of stores licensed and operating in Canada is shown on the x-axis, with average daily Canada-wide sales on the y-axis.
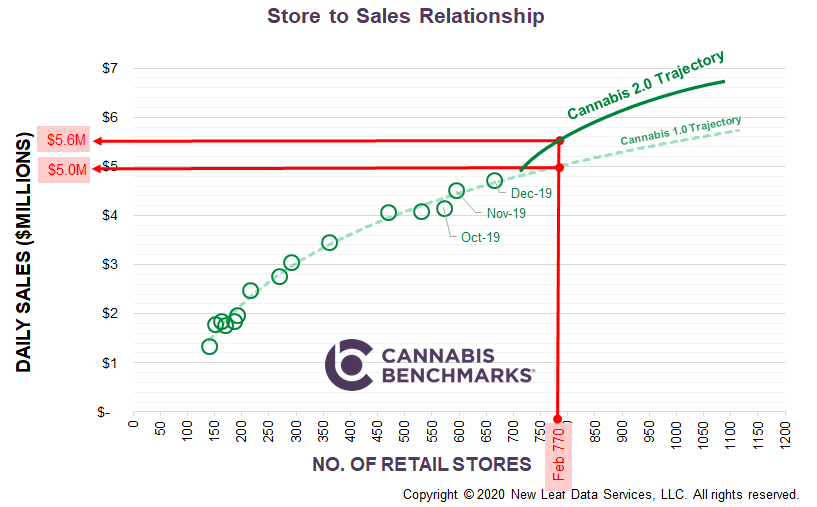
Source: Cannabis Benchmarks
Extending that relationship forward, we can roughly gauge where sales will go based on how many stores open. This is a generalized model for all of Canada. We recognize that incremental opening of stores in a province such as Alberta, which is already home to 55% of the nation’s licensed shops, would have a dramatically different impact on national sales than new stores opening in Ontario, the most populous province in the country where there are only 31 locations operating at the moment. In today’s analysis, we are simply affirming the general point that more stores will help grow sales; this argument has also been put forward by the management of almost every major licensed producer in Canada. In the chart above, we have also outlined the impact of Cannabis 2.0 products hitting the shelves. These newly available products are expected to boost sales by providing more product variety, as well as attracting consumers that might be averse to smoking. Additionally, Cannabis 2.0 products generally have higher price points than flower, which will likely expand sales revenue as existing consumers seek out novel experiences. As the chart illustrates, we anticipate sales jumping to a new trajectory line this year. We expect in-store sales to be 25% higher than they would have been if Canada continued with only Cannabis 1.0 products by the end of this year. Our forecast for January retail sales is C$155M, rising to C$161M in February.
For more data and analytics like this, please sign up to become a BETA client of our market fundamentals dashboard. Please click the link below to register and we will email you directly as our platform becomes available.
If you missed our announcement last week:
We are pleased to share that Cannabis Benchmarks® has begun disseminating its Canada cannabis index data through Nasdaq’s GIDS service. These unbiased indexes provide a variety of benefits for this emerging commodity, including:
– making it easier to reference the market value of product in buy/sell negotiations,
– writing spot and forward contracts on a published index,
– third-party validation for asset valuation (e.g., biological assets), and
– paving the way for more sophisticated financial instruments for hedging, trading, and risk management (e.g., swaps, futures, and other derivative contracts).
Click to read the full press release: Cannabis Benchmarks® Distributes its Canada Cannabis Pricing Indexes on Nasdaq Global Index Data Service