Canada Cannabis Spot Index (CCSI)
Published August 14, 2020

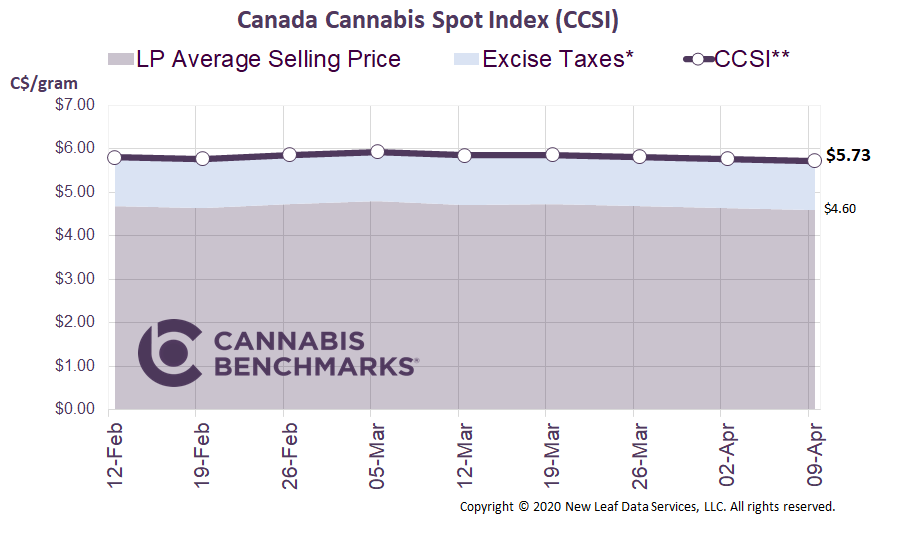
*The provincial excise taxes vary. Cannabis Benchmarks estimates the population weighted average excise tax for Canada.
**CCSI is inclusive of the estimated Federal & Provincial cannabis excise taxes..
The CCSI was assessed at C$6.23 per gram this week, down 1.6% from last week’s C$6.33 per gram. This week’s price equates to US$2,126 per pound at the current exchange rate.
Include your weekly wholesale transactions in our price assessment by joining our Price Contributor Network
If you have not already done so, we invite you to join our Price Contributor Network, where market participants anonymously submit wholesale transactions to be included in our weekly price assessments. It takes two minutes to join and two minutes to submit each week, and comes with loads of extra data and market intelligence.
This week we provide an update on the growing stockpiles of cannabis held in federal and provincial storage facilities, and compare it to the inventory that is piling up on the balance sheets of two major licensed producers.
Statistics Canada released data showing both unpackaged and packaged inventory for May 2020. The trend of expanding unpackaged inventory continued – as shown in the blue area below – but May saw packaged inventory buck the trend with a small decrease. Could this be the first sign of national production slowing? In our opinion, it is a bit too early to tell from this data alone.

Source: Statistics Canada, Cannabis Benchmarks
To get more insight on production and inventory, we turn to data reported this past week in quarterly earnings released by Canopy Growth and Tilray.
Both companies report the total kilograms harvested and sold each quarter. In the charts below, we show each company’s cannabis harvest volumes (solid line) and sales volumes reported for each quarter (dashed line). Both companies, but especially Canopy, experienced significant supply-demand disconnects through much of 2019. We can see cultivation peaked in mid-2019 and has been declining since for both companies, with reduced facility utilization and closures. For example, Canopy reported closing greenhouses in British Columbia in Q1 2020 to reduce the supply glut. Still, the supply-heavy imbalance has continued into 2020 for Canopy, while production and sales for Tilray have lined up more closely since the end of 2019.

(Y axes represents kg equivalent in 1,000s)
Source: Canopy Growth Earnings, Tilray Earnings, Cannabis Benchmarks
Any product that is not sold is either put into inventory or written off (destroyed). The companies are not as forthcoming with that information, but we can get a glimpse by diving into their balance sheets. The balance sheets report inventory as a dollar value, rather than total volume stored; hence it is not a direct comparison to unpackaged/packaged inventory reported in kilograms by Statistics Canada. That being said, the trend in inventory growth should be very close.

(Y axis represents kg equivalent in 1,000s)
Source: Canopy Growth Earnings, Tilray Earnings, Cannabis Benchmarks
The chart shows the two companies’ inventories growing at a similar pace to that reported by Statistics Canada in 2019, but that has not been the case in 2020. Our guess is that inventory volume has continued to grow, but dropping market prices are hitting the value of the inventory. With more inventory at a lower price, the inventory line items on the companies’ balance sheets appear to have flatlined.
For more data and analytics like this, subscribe to the Cannabis Market Insights report developed in collaboration Nasdaq. This in-depth monthly report provides exclusive data and analysis on the legal cannabis industry, focusing largely on the Canadian cannabis market, as well as the cannabis equities market in the U.S.

