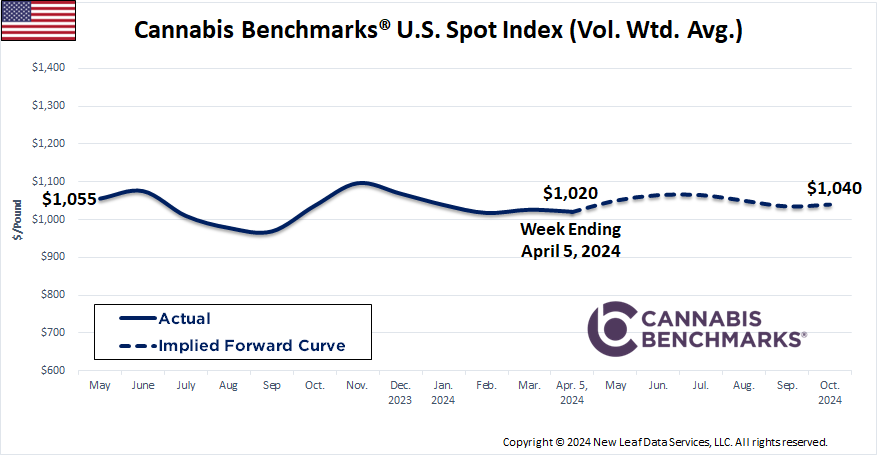
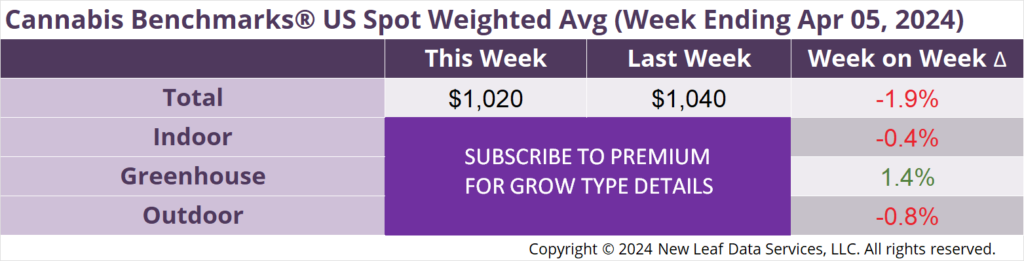
The U.S. Cannabis Spot Index decreased 1.9% to $1,020 per pound.
In grams, the Spot price was $2.25.
Price volatility has been moderate thus far this year, with this week’s spot price of $1,020 per pound being 2.9% higher than the low of $991 on March 8th, and 4.9% lower than the high of $1,072 on January 12th. The U.S. Spot Index has averaged $1,026 YTD.
Price movement across grow types has been highest for greenhouse grown flower, with trading in a 12% range around the average.
As we approach the 420 industry “holiday”, we will be looking closely to see whether the power of the buyer or the power of the supplier is stronger. For many years, sellers commanded premiums as dispensaries sought to keep shelves stocked for the event. As more markets opened, and existing markets became more competitive, buyers were able to use their power to demand discounts so that they could offer sales to encourage traffic. This pattern ended in April of 2020, when buyers were able to secure only a 1% discount versus the month of March. Since then, the average increase in prices from March to April has been 1.3%, 5.3% and 4.6% in 2021, 2022 and 2023, respectively.
In other news, three recent events likely to impact markets over the coming year, and beyond, were the veto of recreational use in Virginia by Governor Glenn Youngkin; the Florida Supreme Court greenlighting Amendment 3, which would legalize adult-use in Florida if passed in November by ballot initiative; and the creation of both a dynamic and chaotic adult-use market in New York following the April 3rd decision by Albany Supreme Court Judge Kevin Bryant to strike down significant portions of the state’s regulatory statutes.
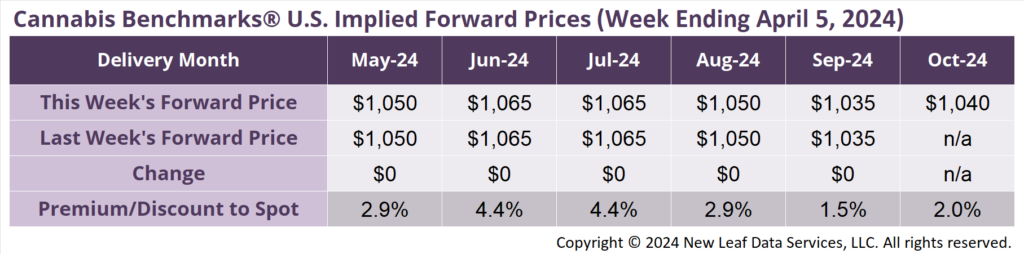
October 2024 Implied Forward initially assessed at $1,040 per pound.
At $1,050 per pound, the May Implied Forward represents a premium of 2.9% relative to the current U.S. Spot Price of $1,020 per pound.
Did you know that you can access state-level retail sales data and much more in our Interactive Charts?
We collect fundamental market data released by states and put it all in one convenient location for you to access it. Looking for more data? Contact Us and let us know what you’re looking for.
