


*The provincial excise taxes vary. Cannabis Benchmarks estimates the population weighted average excise tax for Canada.
**CCSI is inclusive of the estimated Federal & Provincial cannabis excise taxes..
The CCSI was assessed at C$5.02 per gram this week, lower from last week’s C$5.05 per gram. This week’s price equates to US$1,791 per pound at the current exchange rate.
Include your weekly wholesale transactions in our price assessment by joining our Price Contributor Network
If you have not already done so, we invite you to join our Price Contributor Network, where market participants anonymously submit wholesale transactions to be included in our weekly price assessments. It takes two minutes to join and two minutes to submit each week, and comes with loads of extra data and market intelligence.
This week we continue to examine data published in the Ontario Cannabis Store’s (OCS) quarterly Cannabis Insights report, which covers the period from July through September 2021. The report contains a wide variety of useful data detailing how Ontario’s market has developed.
This report focuses on the proportion of sales dedicated to cannabis 1.0 and 2.0 products in Ontario. As a reminder, cannabis 1.0 references the legalization of combustible cannabis flower, cannabis oils, and cannabis seeds in October 2018. A year later cannabis 2.0 began; making available to consumers derivative products such as vapes, edibles, beverages, concentrates, and topicals. The data aggregated in today’s CCSI report reviews a series of OCS quarterly reports to compile a complete view of the trends following the introduction of cannabis 2.0 products.
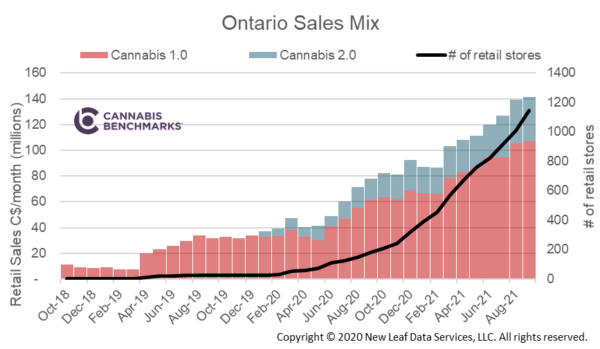
Cannabis 2.0 products created a lot of excitement ahead of their legalization and sales from the different product categories were expected to grow rapidly. With over two years of data, however, we currently see that cannabis 2.0 products make up only a small portion of total sales. As seen in the chart below, total cannabis sales in Ontario have been accelerating with the rapid build-out of brick-and-mortar stores. Since its full roll-out, however, cannabis 2.0 product sales have averaged approximately 23% of total legal Ontario cannabis sales.
Diving deeper into the cannabis sales mix, we see that most consumers prefer the traditional smokeable or inhalable products (dry flower or vapes, respectively), with all other derivative products making up a very small proportion of total sales. That being said, we do see a small increase in spending towards consumable cannabis products as seen in the chart below, which compares the sales mix from September 2020 to September 2021.
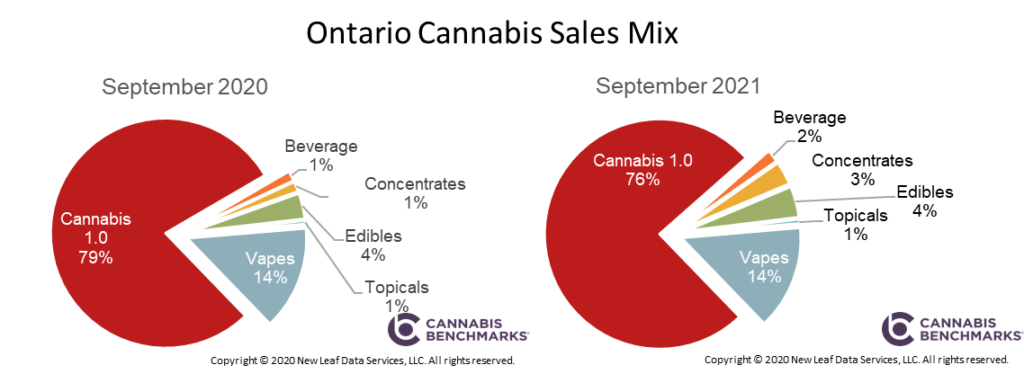
The cannabis industry was hoping for cannabis 2.0 products to capture a larger proportion of sales dollars, as they generally command a premium for the same cannabis input and the product differentiation would pull consumers towards legal supply channels. Consequently, these stats are likely disappointing to Canadian cultivation and processing businesses, which had placed large bets on the cannabis 2.0 release.