

Canada Cannabis Spot Index (CCSI)
Published April 10, 2020

*The provincial excise taxes vary. Cannabis Benchmarks estimates the population weighted average excise tax for Canada.
**CCSI is inclusive of the estimated Federal & Provincial cannabis excise taxes..
The CCSI was assessed at C$6.46 per gram this week, down 0.9% from last week’s C$6.52 per gram. This week’s price equates to US$2,085 per pound at the current exchange rate.
Include your weekly wholesale transactions in our price assessment by joining our Price Contributor NetworkIf you have not already done so, we invite you to join our Price Contributor Network, where market participants anonymously submit wholesale transactions to be included in our weekly price assessments. It takes two minutes to join and two minutes to submit each week, and comes with loads of extra data and market intelligence.
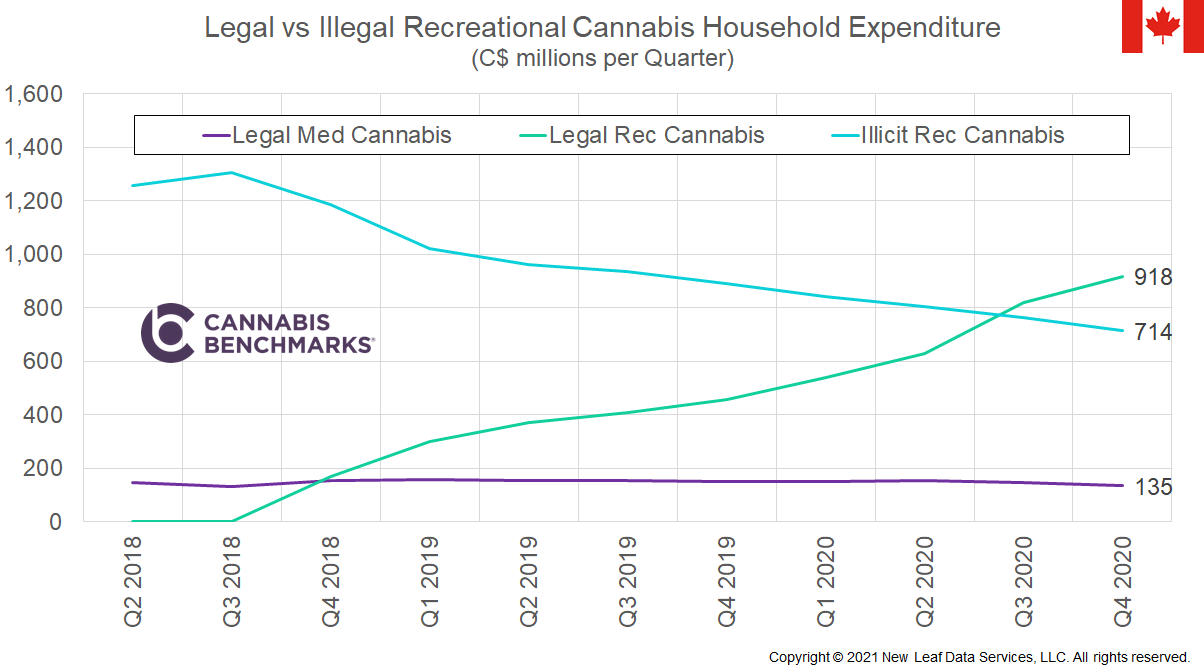
Recreational Cannabis Growth
This week we review currently available and projected sales volume data for non-medical cannabis. Health Canada has been providing very good data on cannabis supply and demand since the legalization of non-medical cannabis. Originally, data was only collected for dried cannabis and cannabis oils, but official reporting has now been extended to cover edibles, extracts, and topicals.
One of the datasets that we have reviewed routinely is the monthly sales volumes for medical and non-medical cannabis. This data generally lagged the market by a number of months, but provided a great deal of insight into how much cannabis was being sold through legal channels. Unfortunately, Health Canada has changed the way they report this data. Instead of reporting monthly sales in kilograms, sales are now reported as packaged units.
Although the data is informative, it is not sufficient to understand fully the true supply, demand, inventory, and overall balance of this emerging market. For example, packaged units of dry cannabis flower come in varying volumes (1 gram, 3.5 grams, 7 grams, etc), as well as pre-rolls of varying sizes. Similarly, packaged units of cannabis extracts can include oil bottles, capsule packages, vape kits, vape cartridges, and more.
In today’s report, we have modelled monthly sales volumes to give a better assessment of trends in the marketplace. We have taken the Health Canada data that is currently reported up until September 2019, and extended it to January 2020. We used the reported Health Canada Retail Trades Sales data for cannabis to formulate our estimates. Sales have been growing in Canada as new retail stores open, retail prices drop, and the population becomes increasingly accustomed to accessing legal cannabis channels.
In January 2020, we calculate that total sales across Canada reached C$154 million, which is C$99.4 million, or 281%, more than January 2019. Since September 2019, our model shows sales have been growing by an average of 5.9% each month.
Source: Cannabis Benchmarks
The sales volumes we have modelled show similar growth. We show the sales volume of dried cannabis in January 2020 at 14,157 kg. This is 8,623 kg, or 255%, more than January 2019. This growth in consumption is what the market needs to balance out the growing production capacity.
Source: Cannabis Benchmarks
The data modelled at the provincial level is very interesting as well. In January of this year, Ontario accounted for 24% of total consumption, Quebec accounted for 20.7% of total consumption, Alberta accounted for 21.6% of total consumption, and BC accounted for 12.8% of total consumption.
Source: Cannabis Benchmarks
For more data and analytics like this, please sign up to become a BETA client of our market fundamentals dashboard. Please click the link below to register and we will email you directly as our platform becomes available.