

Canada Cannabis Spot Index (CCSI)
Week Ending March 26, 2021

*The provincial excise taxes vary. Cannabis Benchmarks estimates the population weighted average excise tax for Canada.
**CCSI is inclusive of the estimated Federal & Provincial cannabis excise taxes..
The CCSI was assessed at C$5.82 per gram this week, down 0.8% from last week’s C$5.86 per gram. This week’s price equates to US$2,101 per pound at the current exchange rate.
Include your weekly wholesale transactions in our price assessment by joining our Price Contributor Network
If you have not already done so, we invite you to join our Price Contributor Network, where market participants anonymously submit wholesale transactions to be included in our weekly price assessments. It takes two minutes to join and two minutes to submit each week, and comes with loads of extra data and market intelligence.
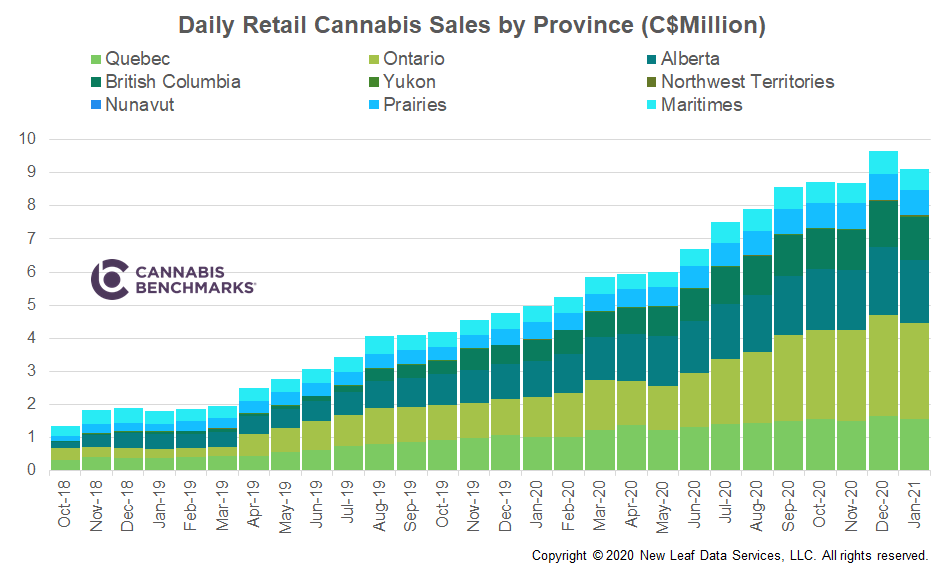
Last week, Statistics Canada released retail sales data for January 2021. While December 2020 sales were adjusted higher by C$1.3M to C$299.7M, January sales came in lower at C$282.8M.
Throughout 2020, total average daily sales increased every month except for November 2020; hence the drop in sales in January is a bit unexpected, especially with the continued expansion in stores.
The chart below shows average daily sales per month, with a drop of C$0.54M per day from December 2020 to January 2021.
Source: Cannabis Benchmarks
We do not see January’s sales decline as the start of a sustained slowdown in cannabis usage, but rather a decrease in spending after the holiday season. A 2018 survey related to alcohol use from Morning Recoveryreported, “The average American sees a 100% increase in their alcoholic drinking habits between Thanksgiving and New Year’s.” With cannabis now legal and accessible, we believe that consumer behavior in regard to alcohol was mimicked in the cannabis realm in December. Additionally, sales trends in state-legal cannabis markets in the U.S. have shown that a month-over-month decrease in purchasing in January of any given year has become almost a customary phenomenon.
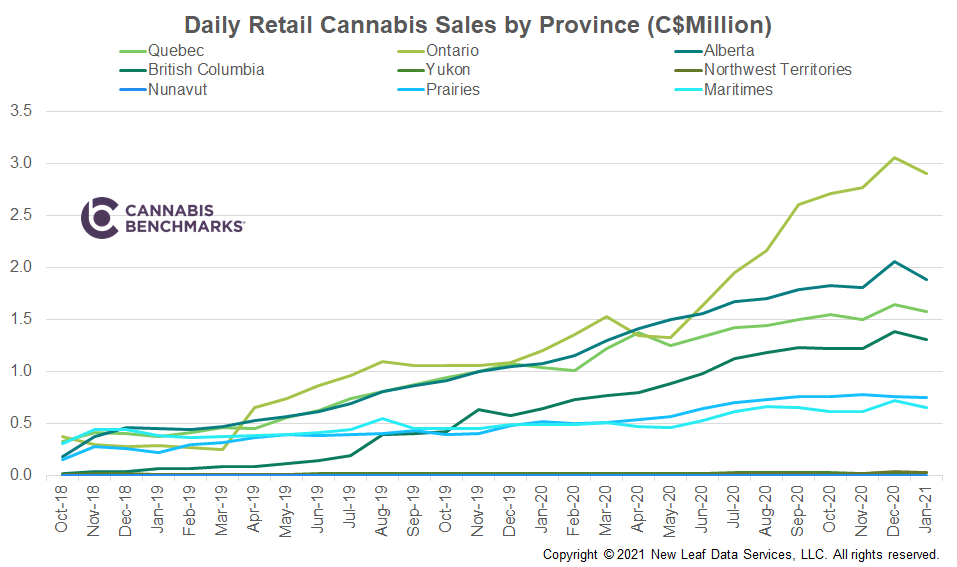
Looking at the month-on-month change in each province, we see that a drop in cannabis sales occurred nationwide without exception. The largest proportional declines were seen in Alberta and the Maritime provinces.
Source: Cannabis Benchmarks
In Ontario, we did not see as much of a decrease as there was a massive expansion in store counts in the month of December, with the Ontario Government making the licensing process more simplified and streamlined. As we have consistently noted, there is a strong correlation between store counts and sales with better accessibility leading to increased sales.
For more data and analytics like this, subscribe to the Cannabis Market Insights report developed in collaboration Nasdaq. This in-depth monthly report provides exclusive data and analysis on the legal cannabis industry, focusing largely on the Canadian cannabis market, as well as the cannabis equities market in the U.S.