

Canada Cannabis Spot Index (CCSI)
Week Ending April 2, 2021

*The provincial excise taxes vary. Cannabis Benchmarks estimates the population weighted average excise tax for Canada.
**CCSI is inclusive of the estimated Federal & Provincial cannabis excise taxes..
The CCSI was assessed at C$5.77 per gram this week, down 0.8% from last week’s C$5.82 per gram. This week’s price equates to US$2,079 per pound at the current exchange rate.
Include your weekly wholesale transactions in our price assessment by joining our Price Contributor Network
If you have not already done so, we invite you to join our Price Contributor Network, where market participants anonymously submit wholesale transactions to be included in our weekly price assessments. It takes two minutes to join and two minutes to submit each week, and comes with loads of extra data and market intelligence.
This week, we once again turn our attention to supply and demand dynamics for cannabis 2.0 products in Canada’s legal cannabis market. The three main product categories that fall under the cannabis 2.0 umbrella are edibles, extracts, and topicals. The official Health Canada definitions of each are as follows:
Edibles: Products that are solid or liquid at a temperature of 22 ± 2°C and that are intended to be eaten or drunk the same way as foods such as chocolate, cookies, sodas, teas.
Extracts: Products made using extraction processing methods or by synthesizing phytocannabinoids and intended for inhalation or ingestion, including by absorption in the mouth or other routes of administration (e.g. vape pens, hash, tinctures, softgels, suppositories).
Topicals: Products that include cannabis as an ingredient and that are intended for use on external body surfaces such as skin, hair, or nails.
In today’s report, we provide an update on the supply and demand associated with edibles and extracts, which are the two larger categories. To date, Health Canada has compiled and published monthly data for production, consumption, and inventory of packaged units through November 2020.
Below are two groups of charts that show the monthly supply and demand for edibles and extracts from the introduction of cannabis 2.0 products in October 2019 through November 2020.
Starting with edibles, we see the production of packaged units by licensed producers ramped up throughout 2020, with only a couple of months not showing gains. The production of packaged units increased at a greater rate than non-medical and medical sales, leading to excess production going into inventory at the federal, provincial, or retail level. Medical sales in this category are almost negligible.
Just as with dry flower cannabis in 2020, the mismatch between supply and demand is causing inventories to rise at massive rates. The current inventory of edible packaged units sits at 14M, which is approximately 8.7 months worth of supply at November’s consumption rate.
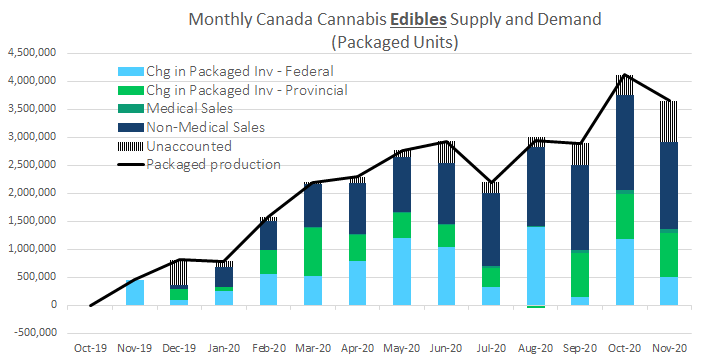
Source: Cannabis Benchmarks, Statistics Canada
The story for extracts is slightly different. Both production, as well as medical and non-medical sales, increased at relatively steadier rates throughout 2020. Still, production ramped up at a faster rate than domestic consumption, leading to growing inventories. The current inventory of packaged units of extracts has not grown as quickly as edibles, but still sits at 10.4M, which is approximately 7.0 months worth of supply at November’s consumption rate. The inventory of extracts grew by 2.8M packaged units or 36% in 2020, after a high build-up throughout 2019, as compared to edibles which grew 1,900% last year.
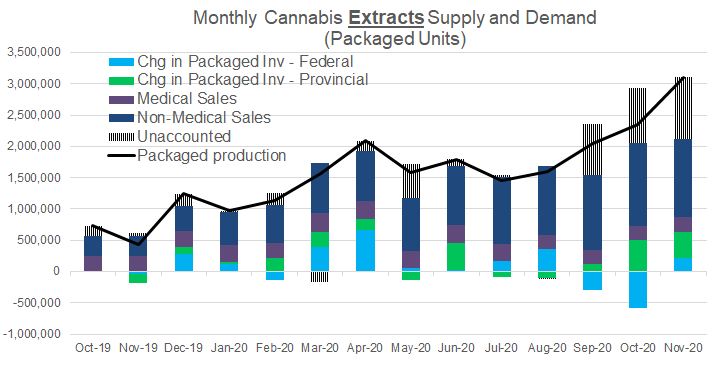
Source: Cannabis Benchmarks, Statistics Canada
In analyzing the Health Canada data, we anticipated the monthly supply and demand figures to perfectly balance where each month:
Supply – Sales (consumption) = change in Federal/Provincial storage
This has not been the case. Each month we observed an excess amount, which we label as “unaccounted” inventory. In the charts above, we identify the “unaccounted” inventory bucket with a black vertical-lined pattern. In the charts below, we show the amounts of “unaccounted” inventory of extracts and edibles, both by month and cumulatively.
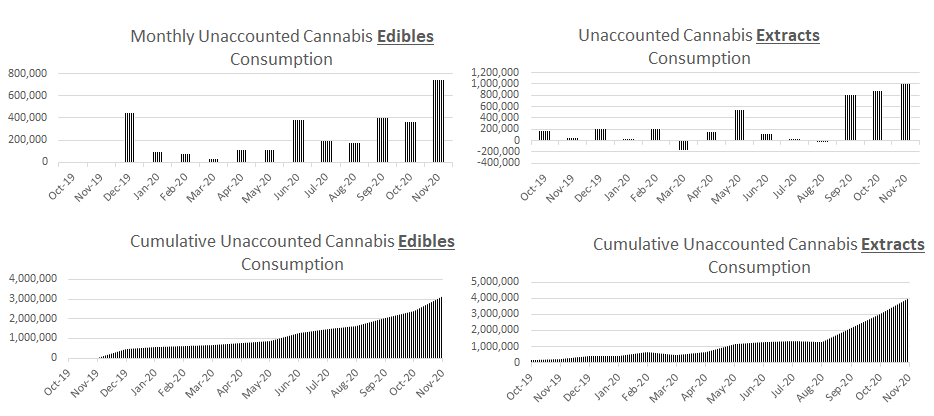
Source: Cannabis Benchmarks
The growing size of the “unaccounted” category is concerning, although it is not clear if these products are being consumed somewhere in the system, being destroyed, or being held in storage. If it is going to Federal or Provincial storage, there are now an additional 3.1M packaged units of edibles and 4.0M packaged units of extracts to account for, making the inventory overhang even larger.
For more data and analytics like this, subscribe to the Cannabis Market Insights report developed in collaboration Nasdaq. This in-depth monthly report provides exclusive data and analysis on the legal cannabis industry, focusing largely on the Canadian cannabis market, as well as the cannabis equities market in the U.S.